

- Waste management in Japan
- Circular economy in Japan
- Waste management in Asia
- Disaster waste management
Japan’s Municipal Solid Waste Survey Dataー(1) Review of Total MSW Discharge Amount Through NIES’s Data Viewing System
English translation: February 2023
Japan’s MSW data are treasure!?
What kind of wastes are generated at your home in daily life? The quality and quantity of wastes that a household generates depend on the characteristics of the household (e.g., elderly household, child-rearing household or single-person household) and where you live. In Japan, each municipality (e.g., prefectures and cities) has specific rules for classification and separation of the household and business wastes (referred to as “municipal solid waste (MSW),” in this article) for collecting them. Although there are some similar trends in how municipalities collect and manage MSW by recycling, incineration and landfilling, various differences exist between them when comparing these processes in detail.
The Japanese government has compiled and presented the country’s MSW data every year since the 1970s, which helps us to understand the status of each municipality as well as the country as a whole. Until 1997, the former Ministry of Health and Welfare collected the MSW data from not only households (i.e., our daily lives) but also businesses (excluding industrial waste). In 1998, the Ministry of the Environment (MOE) took over the survey and has compiled the data since then. They have presented the MSW data including its quality and quantity from its discharge to treatment/disposal, the number of municipal staff in charge of these MSW treatment processes, and MSW management expenditures by each municipality. The latest MSW data (data from 1998 to the present) are available on the MOE’s website (in Japanese), but necessary information can be neither easily extracted as figures and tables nor understood since these data are enormous.
Despite the above-mentioned inconveniences, these long-term statistical information on MSW for about half a century are extremely valuable internationally. Why are they so valuable? It is because no other country in the world has accumulated more municipality-wise statistical data on MSW over a longer period than this Japanese MSW statistics. As the concept of 3R (reduce, reuse, recycle) and proper management of waste are becoming increasingly important, Japan’s MSW data provide us with a basis for understanding the characteristics of the country’s MSW and the regional differences in MSW management (i.e., discharge, treatment, recycling and disposal) from the past to the present. The data also provide us with some insights into necessary actions for future―issues that must be tackled and future directions. They are like treasure with hidden valuable information to predict Japan’s MSW in the future. For developing countries, Japan’s MSW dataset is a good reference to enhance their own MSW management practices.
NIES’s system easily retrieves MSW data and information from Japan’s vast historical records
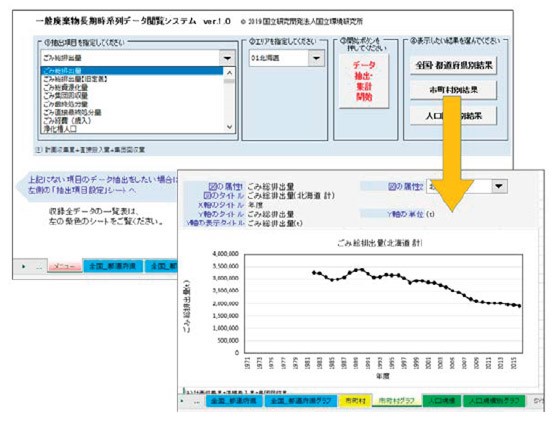
The National Institute for Environmental Studies (NIES) has digitalized some part of this long-term MSW data of Japan as a database and made them available through an easy-to-use data viewing system (referred to as “the Data Viewing System” in this article) for a wide variety of experts and practitioners who are engaged in material cycles and MSW management (e.g., administrative officials, staff of environmental nonprofit organizations (NPOs), business operators and researchers).
Broadly speaking, the MOE’s MSW survey has compiled two types of MSW data, one is the data on MSW management status, and the other is the data on MSW treatment facilities. The NIES research team has recorded both of them in the MSW database and has made available a part of the MSW management status data through the Data Viewing System as a first step.
The dataset in the Data Viewing System is enormous; the records for the early years have about 800 data items and those for the recent years have about 4,200 data items. As mentioned earlier, this system has excellent features: (i) it enables us to use Japan’s old MSW data; (ii) it helps us to view numerical characteristics and trends of each data item over a long period (i.e., for up to about 50 years), and (iii) it makes possible to compare the data of municipalities with similar population size.
Story behind the Data Viewing System development
The Data Viewing System’s outstanding core component is the recorded data. During the early period of the MSW survey from the Japanese fiscal year of 1971 to 1997, the data were not published in a digital format. Only printed copies of the MOE’s publications (e.g., “Japan’s MSW Management,” “MSW Statistics of Japan,” and “Survey Report on Japan’s MSW Management Status”) were made available. The NIES’s research team has digitalized*1 these publications with the cooperation of the MOE and the Japan Waste Management Association. The data from 1998 onwards available on MOE’s website were also added to the system.
The biggest challenge in our Data Viewing System development was processing the data into formats that can be more easily compared and understood. Japan’s MSW management has gradually evolved over these past 50 years reflecting not only the environmental policies but also economic, social and international trends at the time1. Definitions of some data items were therefore changed in certain years. In addition, in Japan during the Heisei Era (1989-2019), a series of municipal mergers (i.e., “the Great Heisei Consolidation”) took place, including the most extensive ones from 2004 to 2006, and the numbers of municipalities were reduced by half. As a result, discontinuity of the MSW data was generated before and after the mergers. Therefore, to compare MSW data, some MSW data such as the amount of waste generated in merged municipalities should be summed up before the merger but other MSW data such as waste generation per capita and recycling require a more complicated calculation. Municipality groups can be changed at the timing of a merger, and data interpretation is made difficult. In order to observe continuous trends of the time-series data (i.e., the item (ii) mentioned earlier) we needed to process and adjust the original data to make them comparable on the same long-term time axis, and this adjustment took a lot of time. If you know this preparatory process, it will help you tremendously in using this system and the original data.
*1. As the first phase of the digitalization, the Survey Reports on Japan’s MSW Management Status have been archived as PDF files (i.e., “archived data”). As the second phase, some main data items have been organized and made available in a digital format so that they can be used with spreadsheet software such as Excel.
Let’s look at actual MSW data using the simplified version of the Data Viewing System
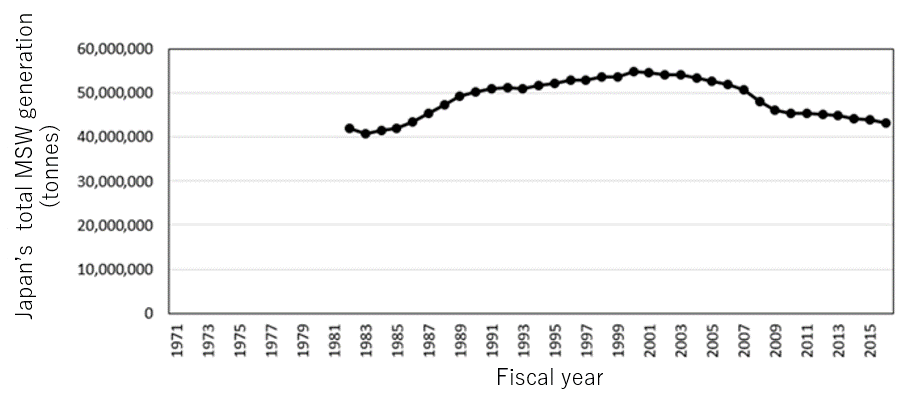
In this final section, we will introduce trends of Japan’s MSW generation that we can see using this simplified version of the Data Viewing System. Figure 2 shows Japan’s total MSW generation since 1982. The discharge amount reached its peak with 54.83 million tonnes in 2000 and decreased since then to 43.17 million tonnes in 2016. These changes seem to reflect a wide variety of events. For example, we examined whether Japan’s population changes affected the total MSW generation amount. The total population had been increasing continuously in and after 2000 until it peaked from 2008 to 2010, and then turned to decrease after 2010. Given these time differences, the changes in the total MSW generation amount does not seem to be caused simply by these population changes. Although the total MSW discharge amount continued to increase during the period from the late 1980s to the early 1990s even after the bubble period, this increasing trend turned into a decreasing trend around 2000. To Japan, the year 2000 was an important year as the Basic Act for Establishing a Sound Material-Cycle Society was enacted. Many related specific recycling laws were also enacted around that year. Progress made in the promotion of 3Rs (Reduce, Reuse, Recycle) in Japan is thus thought to be the biggest factor that has contributed to the decrease of MSW in Japan.
The Data Viewing System and its user manual can be downloaded from the links below. Using the system, you can easily make tables like Fig. 3.
Download the manual [PDF File 1.2MB] (Japanese version only)
Download the Data Viewing System [Excel File, 6.4MB] (Japanese version only)
References
- Tasaki T. (2019) Prospects of Japan’s Waste Management and Material Cycles in the Reiwa Era (1): Looking Back on the Showa Era and Heisei Era, NIES Material Cycles Division Online Magazine, June 2019 issue