- Waste management in Japan
- Circular economy in Japan
- Waste management in Asia
- Disaster waste management
Per Capita Municipal Solid Waste Generation
Definition of “per capita MSW generation”
According to Japan’s Waste Management and Public Cleansing Act, any waste other than industrial waste is defined as “general waste.” Based on this definition, liquid waste such as night soil and Johkasou sludge is also included in municipal waste. In public administration terms however, municipal waste usually refers to solid waste excluding the liquid waste. This article refers to this solid waste as municipal solid waste (MSW). MSW is classified into two types: household waste generated from our daily lives, and similar waste from businesses such as restaurants and offices. According to the Ministry of the Environment of Japan (MOEJ), total amount of MSW generated is defined as “the amount of MSW collected by local governments for proper treatment and recycling (volume by government collection) + the amount of MSW directly carried into municipal treatment facilities by generators (volume directly carried in by individuals) + the amount of collection of recyclable MSW by local communities (volume by group collection).”
The amount of MSW generated has a strong positive correlation with population. The MSW generation amount increases or decreases according to population changes. If population changes, evaluating effectiveness of each municipality’s MSW reduction efforts will become difficult. Therefore, we use an indicator “per capita MSW generation per day” to evaluate the impact of such MSW reduction efforts over time. This indicator also enables comparison of the MSW generation intensity between municipalities which is otherwise difficult due to differences in their population sizes. Based on MOEJ’s definition, per capita MSW generation per day is calculated by using Eq. (1):

where ma is per capita MSW generation per day (kg/person/day), m is total annual MSW generation amount (tons/year), p is total population (persons), and d is the number of days in a year (365 or 366, days). When calculating per capita MSW generation per day, the total annual MSW generation amount (the numerator) does not include the amount of waste disposed of at source (i.e., the amount of waste disposed by residents themselves where MSW collection service is unavailable), but the total population (the denominator) includes the population of these residents disposing of their waste at source. According to statistics for the Japanese fiscal 2015 published by MOEJ, the population disposing of their waste at source was about 15,000, or 0.01% of the total population of Japan.
Per capita MSW generation per day for 2015 was calculated as 0.94 kg in Japan on average. MOEJ annually compiles data on MSW from all 17,000 or more municipalities and publishes an annual report on treatment of MSW in Japan. The report is available to anyone who wishes to obtain the statistical data on MSW treatment for all municipalities in Japan. I believe that no country in the world other than Japan has compiled and published MSW statistics so thoroughly. For your information, the National Institute for Environmental Studies also offers a web-based interactive map of Japan (available only in Japanese language) facilitating mapping of per capita MSW generation status and relevant information for each municipality.
Comparison of MSW generation between Tokyo and Bangkok
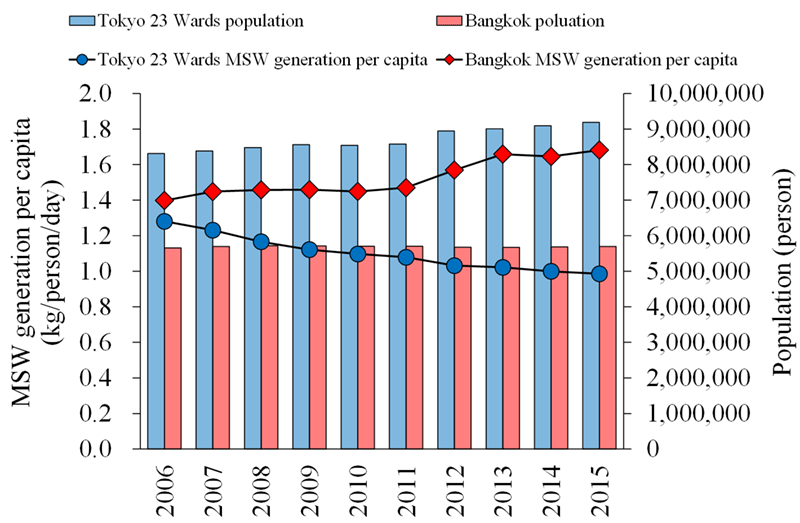
The total MSW generation in Japanese municipalities is showing a declining trend while it continues to increase in major cities in Southeast Asia. Bangkok, the capital of Thailand, is one of the fastest growing cities in Southeast Asia. Figure 1 shows changes in the population and MSW generation per capita per day for the 23 Wards of Tokyo (fiscal year basis) and Bangkok (calendar year basis) for the last 10 years. During this period, the total amount of MSW generated in the 23 Wards of Tokyo decreased although their total population increased. This caused the MSW generation per capita per day for the 23 Wards to drop from 1.28 kg/person/day in 2006 to 0.99 kg/person/day in 2015. On the other hand, the population of Bangkok for the same period remained constant although its total MSW generation increased. This caused the MSW generation per capita per day for Bangkok to increase from 1.40 kg/person/day in 2006 to 1.68 kg/person/day in 2015. However, the following points should be noted.
Rural-to-urban migration has been prominent not only in Bangkok but also in many other cities in Southeast Asia for seeking jobs. However, some migrants do not register themselves as residents of the urban municipalities they moved to. As the population of such migrants are not recorded in the urban municipalities’ registration systems, the population is not reflected in the municipal demographic data either. In developing countries, the percentage of the population receiving municipalities’ MSW collection service, that is collection rate, is still not high at present. However, it has risen to almost 100% in densely populated urban areas as MSW collection is a very important public service in these areas for maintaining sanitary environment.
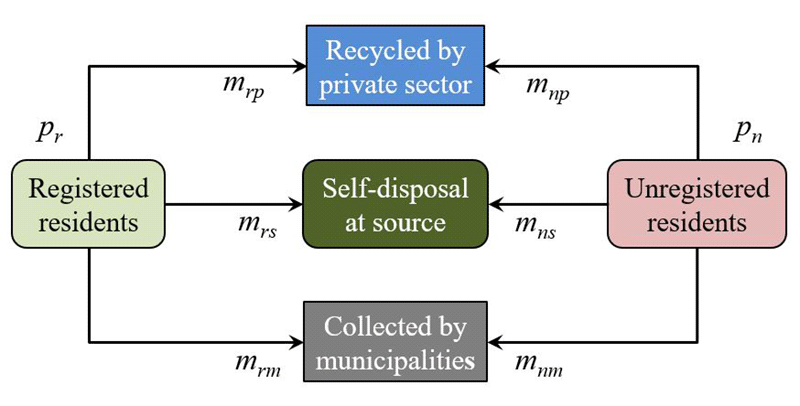
Typical household waste generation and discharge streams in Southeast Asia are shown in Fig. 2. In urban areas, the amount of self-disposal at source is not large as waste collection service is adequately offered by local governments. However, unlike in Japan, local governments do not recycle the waste they collect. It is the private companies that recycle the waste they buy from households. In a hypothetical case in Southeast Asia, per capita MSW generation per day is calculated by using Eq. (2):

where mrm is total annual MSW (household waste) generation amount from registered residents (tons/year), mnm is total annual MSW generation amount from unregistered residents (tons/year), mo is total annual MSW generation amount from non-household sources (tons/year), pr is registered population (persons), and pn is unregistered population (persons).
In general, an inaccuracy in calculating per capita MSW generation per day is associated with the fact that unregistered population is not accurately grasped. Another inaccuracy may result from the fact that local governments collect MSW also from unregistered residents if they live in an area covered by MSW collection services. Earlier in this article, we calculated that the per capita MSW generation per day for 50 districts of Bangkok in 2015 was 1.68 kg/person/day. It was calculated by including household waste from unregistered residents in the numerator and excluding the unregistered population from the denominator. However, the unregistered population is too large to be ignored. If we recalculate on the assumption that the unregistered population is half the registered population (i.e., the actual population is set to 1.5 times the statistical value), the per capita MSW generation per day for Bangkok would become 1.12 kg/person/day.


- Note 1. Registered residents refer to residents who are recorded in municipal civil registration system. Unregistered residents refer to residents who are not recorded in the system.
- Note 2. p is population, and m is the amount of MSW generated.
Important points in comparing MSW generation between municipalities
It is not simple to compare per capita MSW generation per day between Japanese municipalities or municipalities in different countries. In addition to the different handling of unregistered population in the calculation, we need to pay attention to different definitions of MSW and data reliability. The definition of MSW varies between municipalities. Different countries define differently whether waste generating from business activities is included in MSW or separated as industrial waste. There are also some items that are classified as general waste but are not included in total MSW generation amount. For example, in Japan, total MSW generation amount does not include used papers that private recycling companies collect from households; plastic bottles and cardboard that are collected at specific locations such as supermarkets; and some used home appliances (i.e., air conditioners, TVs, refrigerators, freezers, washing machines and drying machines) that the Home Appliance Recycling Act obliges manufacturers to recycle. In developing countries, the amount of waste collection by private recyclers is generally not reflected in the total MSW generation as municipalities do not fully grasp such amount. There is also a problem of reliability of the data regarding total MSW generation amount. In developing countries, not all municipal waste treatment facilities have proper weighbridges (i.e., large scales for weighing trucks carrying waste). Municipalities without such weighbridges estimate total MSW generation amount from the number and capacity of trucks carrying MSW to treatment facilities and landfill sites. Data provided by such municipalities are not always reliable.
For the above-mentioned reasons, we need to clarify certain points before drawing conclusions on the comparison results of per capita MSW generation per day between municipalities: whether the definition of MSW is the same among them, which waste is missing in their total MSW generation amount, and whether their total MSW generation and population data are reliable. Clarification on all these points is essential for investigating why some municipalities generate larger (or smaller) volume of MSW and what measures should be taken in future for enhancing their MSW management.


